- Home

- Report


Auto-refresh a Dashboard
Ever wanted to show a dashboard on a big screen in a reception area or office?
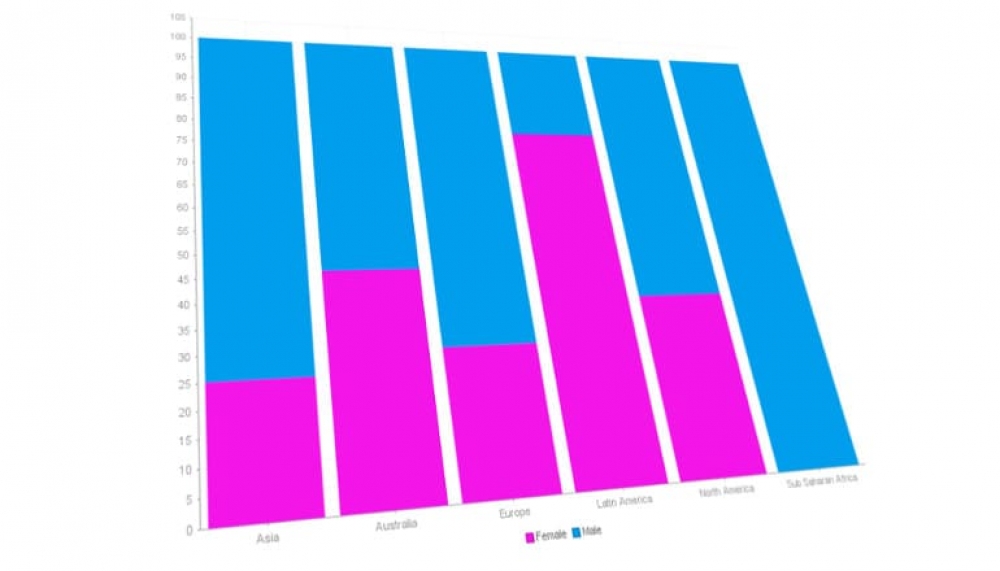
100% Stacked Column Charts
The 100% Stacked Column Chart is an extension of the Stacked Column chart in that it compares the percentage that each value contributes to a total.

Creating a Year over Year (YOY) Comparison
This article describes how to build a report to compare year over year data.
Time Series Charts
When using a date field in a chart, you have the option to enable the Time Series functionality. This will allow you to convert your time axis to display as a proper time scale and view your data trends and patterns over time, rather than what I call a categorical type display.

Displaying better narratives
A great way to make your charts and dashboards more usable is to include dynamic text based on user selections. This can be achieved using Yellowfin’s new Text Parameter Replacement feature.
Popular Posts
- Freehand SQL reports Written on Sunday, 18 November 2018 21:18
- Speed up your website data analysis Written on Monday, 09 July 2018 19:27