- Home

- Gawie Herbst

Tooltips on your Dashboards
A tooltip is a small, interactive, and textual hint that is often used to specify additional information about a something when the user moves the mouse pointer over an element. Tooltips are usually highly contextual and can be attached to any active element on a dashboard, this includes icons, images, and buttons.

"TableValue" Text widget parameter
Text Widget Parameters allows you to add dynamic values to your charts by using Yellowfin’s text widgets. These include the name and description of the report, filters, parameter values and even column totals.
Connecting to an Exasol Database
EXASOL is the worlds fastest in-memory, high-performance analytic database which is designed for big data analytics.
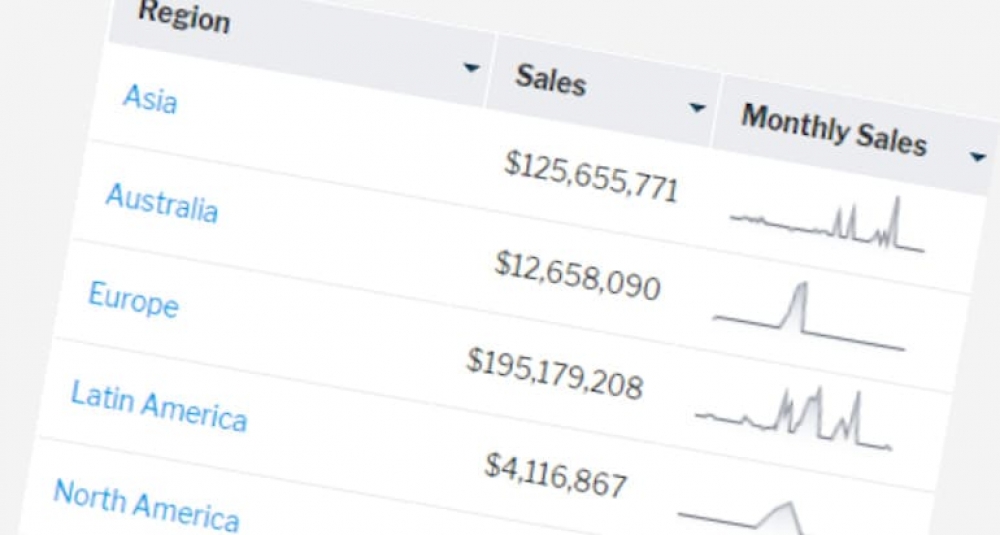
Sparklines
Most of the time, all you need in a table is data as text and numbers. But sometimes, you’d like to visualize results in each row, too. That’s especially true when each row of data is a trend over time.

Improve the readability of reports
One of the main design concepts of reports is to make sure that your audience understand and can interpret the data. If they don’t understand the message you are trying to convey, you have failed, and the report is of no value to the business.

Changing your Yellowfin configuration database password
I think we can all agree that changing your passwords regularly is good practice to reduce your risk of exposure and avoid several dangers.

Hiding columns from users
Sometimes you need to secure or restrict access to individual columns within a view.

Turning Text into Hyperlinks
This article explains how to use the Link to URL column formatting option to create hypertext links within a field.
Popular Posts
- Freehand SQL reports Written on Sunday, 18 November 2018 21:18
- Speed up your website data analysis Written on Monday, 09 July 2018 19:27