There are hundreds of different chart types out there, but pie charts are probably the most controversial. If one does a Google search on pie charts a multitude of articles will appear – both advocating the use of pie charts but also discouraging you to use this type of graph.
Some experts will tell you to NEVER EVER use pie charts. Others say use them sparingly but apply strict rules when doing these charts.
Personally, I believe that pie charts are one of the most overused and misused visualizations.
What is a Pie Chart?
A pie chart is a circular graph that is used to display a percentage of total, in other words to show the relationship of the individual slices of the pie to the whole. All the segments must add up to 100%.
Why are they so popular?
Old habits die hard. When someone is asked why they prefer pie charts, they can provide you with a plethora of justifications. True believers will always tell you that pie charts are really useful. It is what they have always used and they probably don’t see the need to change their methodology.
Another reason could be that charts are easy to create and visually appealing. Let’s face it, people just love their circles!
The circular shape of pie charts conveys to the reader that they are looking at the proportion of a whole – this is probably the only strength of pie charts. When using a bar or column chart to show percentage of total, it is much more challenging for the reader to determine that all the bars add up to a 100%.
Here is an example:

The problem with them?
- Comparing slices
They can be difficult for the reader to interpret. The biggest issue is that it is very difficult for our eyes to compare the size of one slice to another. This is even more evident if the slices are not next to each other.
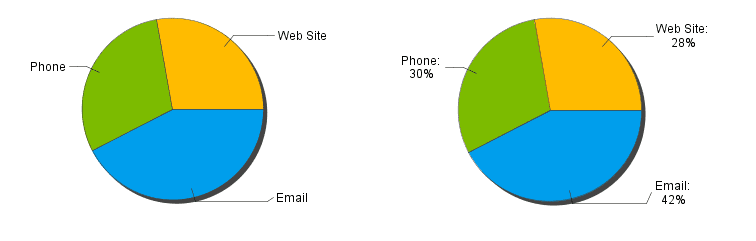
When looking at the chart on the left, it is very difficult to know if the value for Phone or Website is the biggest. Adding labels with the percentages will give us a much better idea.
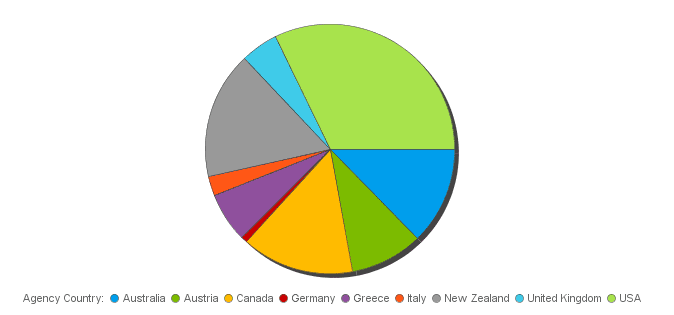
- Use of legends
A Legend is typically added when we use a lot of slices and don’t have room on the chart to display all the labels. This makes the chart harder to read as your eyes will have to travel back and forth between the chart and the legend.
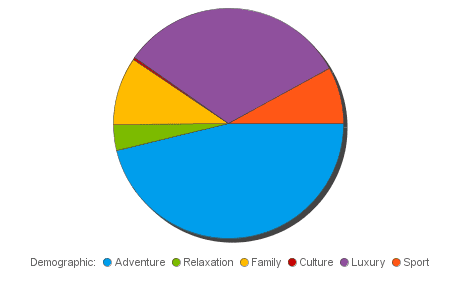
- Too many slices
The more categories or slices you have on the chart, the harder it can be to read. If your users insist on the use of a Pie, keep the number of slices to a minimum. The recommendation is between 4 and 6 slices; this makes it easier to compare.
An example of a chart with too many slices:
- Negative Values
The areas and angles of the slices cannot show negative values.
The illustration below from www.darkhorseanalytics.com summarizes everything above so I just could not resist sharing it with you!

I will admit, there is a place (albeit very small) for pie charts. However, pie charts seldom are the best way to present data as there are better alternatives. To make sure you show the right data in your graph, it is therefore crucial that you choose your graph wisely.